Monday starts with a normal dock schedule. By 9:30, three unannounced truckloads of decommissioned rack servers, Cisco switches, and boxed laptops are waiting for unload. The warehouse team starts moving pallets twice, the data destruction queue slips, and the pickup calendar for the rest of the week stops making sense.
That kind of disruption is common in IT asset disposition. Demand doesn't arrive like a steady retail stream. It lands in bursts tied to lease expirations, office closures, audit prep, cloud migrations, and data center shutdowns. If you handle equipment returns, spare parts harvesting, or secure pickup scheduling, a solid demand forecasting technique isn't an academic exercise. It's an operational control system.
From Reactive Chaos to Proactive Control
An ITAD operation usually looks stable until one client changes timing. A hospital group accelerates a laptop refresh. A bank clears a storage room before an audit. A colocation customer de-installs aging servers in one sweep. Suddenly, labor, cages, dock doors, and secure media handling all compete for the same hours.

Demand forecasting fixes the root issue. It helps teams anticipate inbound asset volumes, likely service mix, and the timing of pickups before operations get pinned against the wall. In ITAD, that means forecasting more than “how much.” It means asking what type of material is coming, what percentage needs shredding versus resale evaluation, and which accounts are likely to create spikes.
A lot of firms still don't model these spikes well. In sectors like IT asset disposition, demand often spikes around audits, decommissioning projects, and mandated hardware refreshes. However, a 2023 McKinsey survey on supply-chain planning highlighted that only 34% of organizations could explicitly model demand driven by these regulatory or audit cycles, revealing a significant gap in practice (practical summary of the survey finding).
What better control looks like
Teams that forecast inbound demand can plan around events instead of reacting to them.
- Warehouse flow: Reserve staging for towers, laptops, or rack gear before trailers arrive.
- Data destruction capacity: Match shred days and wipe stations to expected media volumes.
- Account planning: Align customer refresh schedules with lifecycle planning such as IT asset lifecycle management.
Practical rule: In ITAD, the forecast doesn't need to be perfect to be useful. It needs to be early enough to change staffing, floor space, and transportation plans.
What Is Demand Forecasting in IT Asset Management
Retail forecasting often behaves like reading a river. You track flow, seasonality, and recurring movement. ITAD forecasting is closer to tracking geysers. The pressure builds out of sight, then equipment appears in a dense, irregular burst.
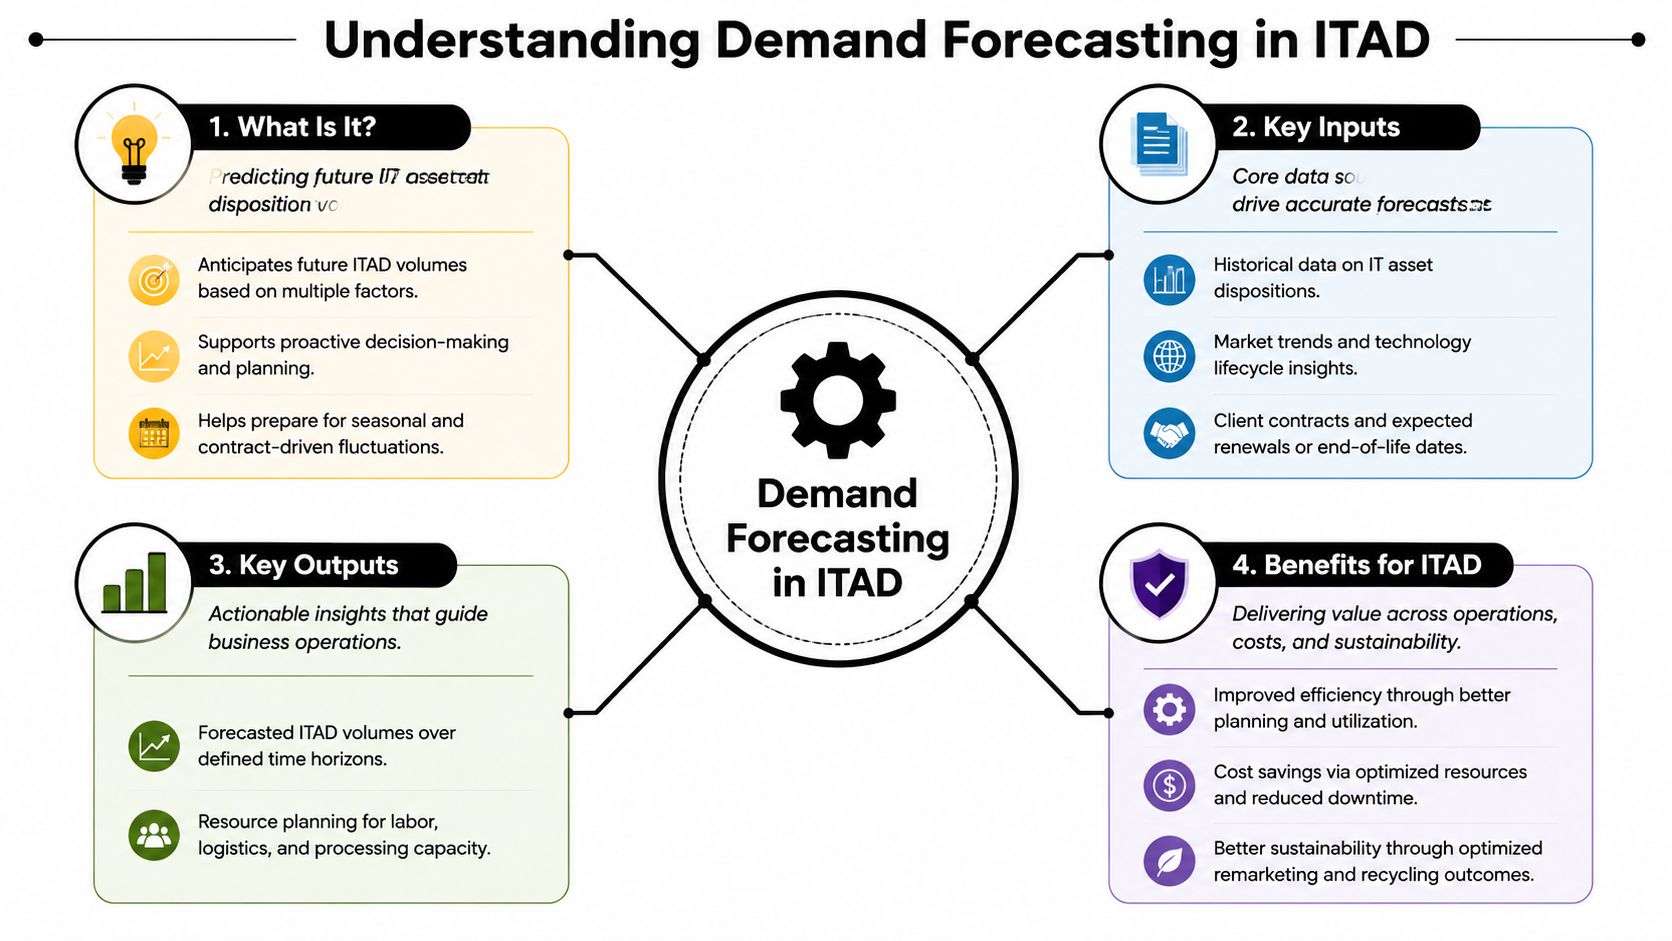
A practical definition is simple. Demand forecasting in IT asset management means estimating future inbound equipment, service demand, and parts requirements so operations can allocate labor, logistics, and processing capacity ahead of time.
What you're actually forecasting
For an ITAD company, the forecast usually has three layers.
| Forecast area | What it includes | Why it matters |
|---|---|---|
| Inbound returns | Laptops, desktops, servers, SAN gear, networking hardware, mobile devices | Determines dock, warehouse, and transport planning |
| Service mix | Data wiping, hard drive shredding, de-racking, testing, resale, product destruction | Determines labor skill mix and equipment utilization |
| Parts demand | SSDs, memory, laptop screens, power supplies, fans, rails, adapters | Supports refurbishment and harvest decisions |
A good forecast separates asset classes. A pallet of Dell Latitude laptops doesn't move through the building like a trailer of EMC storage arrays. The receiving time is different. Testing is different. Data-bearing media handling is different. Resale potential is different.
Inputs that matter in ITAD
Starting with historical pickups is a common practice, but it isn't enough. The stronger model blends internal records with known client events and external drivers. A useful overview of asset management for facilities helps frame why building-level moves, lease transitions, and equipment programs affect disposition timing.
Core inputs often include:
- Historical records: Prior pickups by client, asset type, weight, count, and service line.
- Contract timing: Lease ends, refresh cadence, migration schedules, and relocation dates.
- Sales intelligence: Accounts in proposal stage, likely expansion, and upcoming decomm projects.
- External signals: Regulation changes, security initiatives, and enterprise IT spending cycles.
The forecast should tell operations what is likely to hit the dock, not just what happened last quarter.
That distinction matters because IT asset disposition is driven by corporate programs and compliance deadlines as much as by routine replacement.
Four Core Demand Forecasting Techniques Compared
Most ITAD teams use some mix of judgment, statistics, causal logic, and automation. The mistake isn't choosing one camp. The mistake is forcing one method onto every problem.
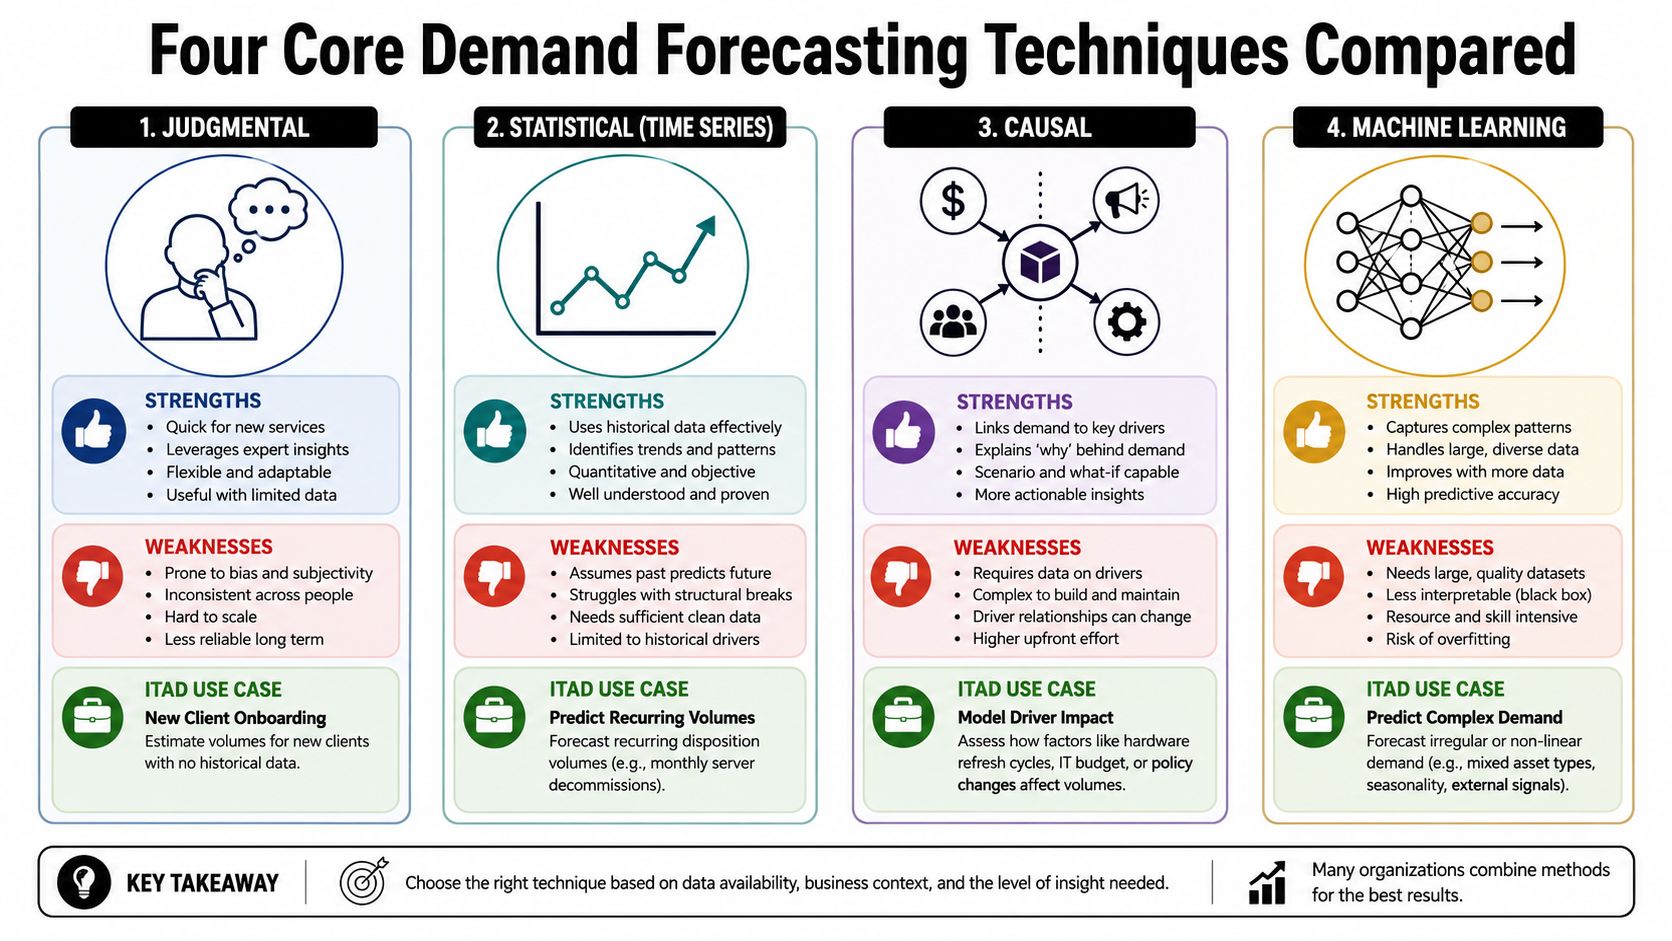
The four methods in plain terms
Judgmental forecasting uses account-manager knowledge, sales input, and executive experience. It's useful when a client announces a Q3 data center exit or when a healthcare system plans a device swap but hasn't released exact counts.
Statistical time series forecasting uses historical patterns. This works best when you have repeated pickups, recurring school district laptop cycles, or stable monthly spare-parts demand. If you want a deeper technical refresher, these expert workflows for time series are a helpful companion.
Causal forecasting links demand to known drivers. In ITAD, those drivers may include refresh schedules, compliance policy changes, office closures, or announced server replacement programs.
Machine learning forecasting handles larger datasets and many variables at once. It can be useful when you need to combine customer history, asset category, project status, geography, and seasonality into one prediction process.
What the trade-offs look like
| Technique | Best use in ITAD | Strength | Weakness |
|---|---|---|---|
| Judgmental | New enterprise projects | Captures real customer knowledge fast | Bias and inconsistency |
| Statistical | Recurring pickups and repeat asset streams | Good for baseline planning | Can miss one-time events |
| Causal | Refresh waves and regulation-driven demand | Explains why demand changes | Needs reliable driver data |
| Machine learning | Multi-account, multi-SKU forecasting | Handles complexity | Harder to explain and maintain |
The broad direction is clear. A large-scale study found that forecast accuracy improved by roughly 20 to 30% when companies moved from simple judgmental methods to more advanced quantitative techniques like time series models, with MAPE often falling from a 25 to 40% range to a 10 to 20% range (demand forecasting overview).
What works and what doesn't
What works is layering methods. Use a statistical baseline for routine returns, then adjust it with account intelligence. Use a causal model when a customer's hardware refresh date is known. Bring machine learning in only when data volume and process discipline justify it.
What doesn't work is relying on gut feel for every account, or installing an advanced model without clean pickup history, asset coding, and ownership.
A forecast should be explainable at the dock level. If the operations manager can't tell why next month looks heavy, the model won't earn trust.
Choosing the Right Model for Your ITAD Scenario
The right demand forecasting technique depends on the shape of the problem. Volume alone doesn't decide it. Timing certainty, data depth, and event drivers matter more.
Scenario-based model matching
If you're forecasting routine weekly pickups from small and midsize business clients, start with a time-series model. Exponential smoothing is often enough. These pickups usually have some rhythm, even when individual weeks swing.
If you're forecasting a major enterprise hardware refresh, use a causal model. Tie expected inbound volume to the client's lease-end schedule, migration plan, or approved capital refresh. That gives operations a planning window for labor, trucks, and secure processing.
If you're forecasting spare parts demand for harvested components, use a model suited for intermittent demand. Parts demand in ITAD is rarely smooth. One week you need multiple SSDs and laptop panels for refurbishment. The next week demand is quiet.
A useful benchmark exists here. For the intermittent demand typical in IT hardware end-of-life streams, time series models like Holt-Winters exponential smoothing are highly effective. A study of over 3,000 real-world time series showed that models with optimized smoothing parameters can reduce forecast error by 15 to 30% compared with naive approaches (technical discussion of the method).
A simple decision guide
- Use judgmental input when the service is new, the account is new, or the event is one-time.
- Use time series when the flow repeats, even if it's imperfectly regular.
- Use causal models when you know the event driver, such as a contract milestone or policy deadline.
- Use machine learning when many variables interact and you have enough clean historical records.
Examples from the floor
A school system returning Lenovo ThinkPad fleets after term closeout can often be forecast from past cycles.
A bank consolidating branches after a facilities change needs a causal approach because the trigger isn't historical pattern. It's a business decision.
Dell OptiPlex power supply demand for refurb stock often benefits from intermittent-demand logic because the parts move unevenly.
For organizations recovering value from retired equipment, asset recovery services in Georgia illustrate why forecasting should connect resale, testing, and parts harvesting instead of treating inbound volume as one generic stream.
Data Requirements and Key Evaluation Metrics
Forecasting fails fast when pickup records are messy. If client names vary across systems, server pallets are coded as general scrap, or drive counts live in email threads, the model won't have much to stand on.
The minimum data set
You don't need a perfect data warehouse on day one. You do need consistency.
- Pickup history: Client, site, date, asset family, units or pallet count, and service requested.
- Project data: Lease expirations, relocation schedules, decommission dates, and contract renewals.
- Processing outcomes: Resale, recycle, shred, wipe, parts harvest, and downstream turnaround.
- Event records: Audits, office closures, cloud migrations, and fleet replacement milestones.
An academic review of forecasting methods notes that practitioners commonly build stronger forecasts with inputs such as customer orders, point-of-sale data, promotions, price information, and macroeconomic indicators. In an ITAD setting, the equivalent is customer return history, project schedules, service drivers, and broader business indicators that shape equipment retirement timing (forecasting methods review).
Metrics that actually help
MAPE tells you how far off the forecast was in percentage terms. It's easy for managers to understand, but it can get awkward when actual volume is very low.
RMSE helps when larger misses should count more heavily than small ones.
Bias shows whether the team consistently over-forecasts or under-forecasts. In ITAD, chronic under-forecasting is what creates dock congestion and overtime.
Watch for bias: A forecast that's “close on average” can still hurt the operation if it misses high-volume weeks in the same direction every time.
For secure media services, it's also useful to compare forecasted destruction demand with actual chain-of-custody throughput. Standards-oriented processes such as NIST SP 800-88 guidance reinforce why media counts, service type, and timing should be tracked carefully.
Implementation Steps and Common Pitfalls
Many teams don't need a massive transformation program. They need a repeatable operating rhythm.
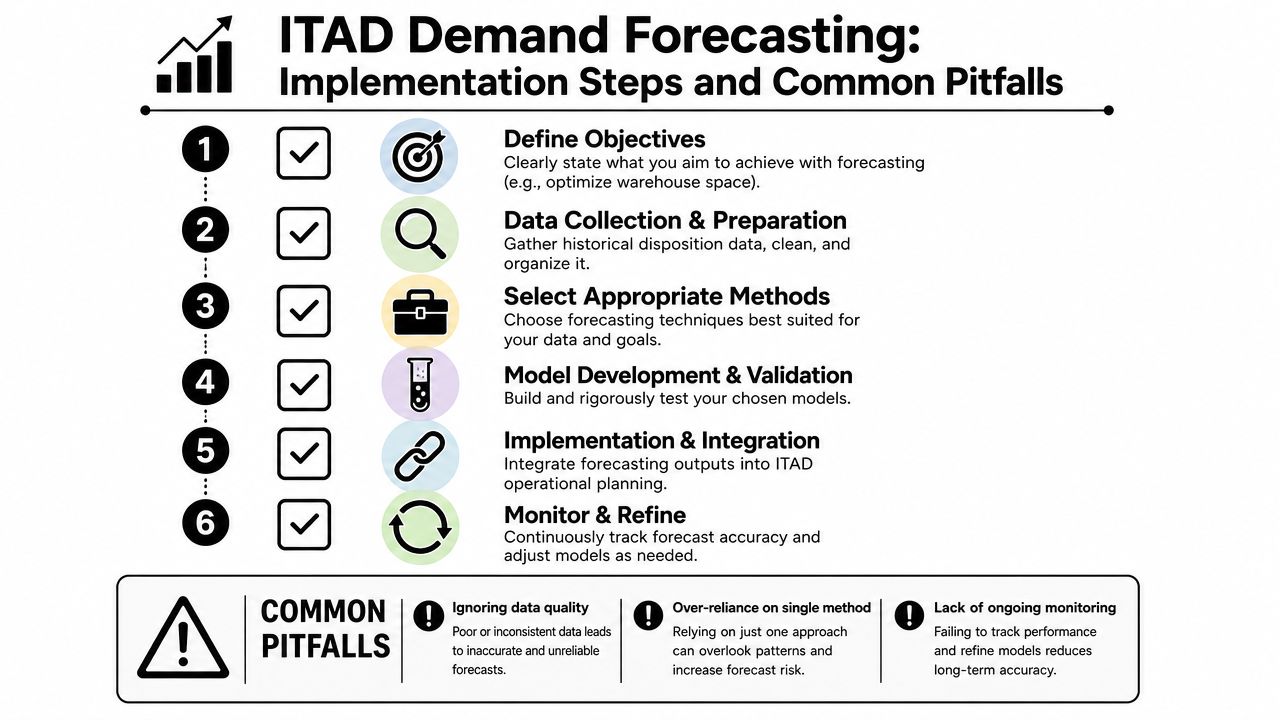
Best-practice demand forecasting processes include defining objectives, specifying needed data, collecting and cleaning data, selecting and testing methods, analyzing outputs, and repeatedly monitoring accuracy with metrics like MAPE or RMSE to improve performance over time (IBM demand forecasting process overview).
A practical rollout path
Start with one operational objective
Pick something concrete, such as improving weekly pickup scheduling, reducing dock congestion, or planning hard drive shred capacity.Build one clean pilot dataset
Use a limited scope. One service line, one region, or one account segment is enough to start.Test a baseline model first
Compare a simple naive forecast against exponential smoothing or a basic causal model. If the advanced option doesn't beat the baseline, don't promote it.Review forecast output with humans who know the accounts
Account managers often know about relocations, closures, or refresh timing before the data does.Tie the forecast to action
If the result doesn't change labor plans, dock allocation, transportation booking, or pricing decisions, it becomes a report nobody uses.
The pitfalls that derail ITAD teams
- Using retail logic for lumpy enterprise events: Consumer-style seasonality models often miss project spikes.
- Skipping account-team input: Sales and client success usually know about decomm timing first.
- Buying complexity too early: A spreadsheet with disciplined review often beats software nobody trusts.
- Treating forecasting as a monthly ritual: It needs ongoing updates as project dates move.
A disciplined operating model matters as much as the math. That's why IT asset management best practices should connect forecasting with receiving, logistics, compliance, and value recovery.
Your Strategic Advantage in Asset Management
Demand forecasting isn't just a planning exercise. It's how ITAD operators protect service quality when customer timing shifts without much warning. Better forecasting leads to cleaner scheduling, steadier warehouse flow, stronger client communication, and more confident decisions about parts harvesting versus recycling.
Start simple if you need to. A basic time-series forecast for routine pickups, plus judgment from account managers on major projects, is already a meaningful improvement over reactive scheduling. Over time, the process can mature into causal and multi-factor models that reflect refresh cycles, compliance events, and decommission programs.
For teams thinking beyond individual pickups, this broader view of mastering asset lifecycle management is useful because disposition demand is shaped upstream by procurement, deployment, support, and retirement decisions.
The companies that forecast well don't eliminate uncertainty. They make it manageable. In ITAD, that's the difference between scrambling around inbound spikes and running an operation that stays in control.
If your organization needs a secure, disciplined partner for nationwide pickups, data destruction, IT equipment disposal, and electronics recycling, contact Beyond Surplus. They help businesses manage end-of-life IT assets with compliant handling, chain-of-custody documentation, and practical support for complex disposition programs.